Discover Profitable Real Estate Investment Analytical Software Powered by AI
Tap into powerful real estate analytics software that uncovers high-yield markets, tracks vacation rental trends, and identifies long-term investment hotspots across the U.S.
✓ No credit card required ✓ Free market analysis ✓ Cancel anytime
Live Market Data
Miami, FL
24.3%
$189
Austin, TX
21.7%
$156
Nashville, TN
19.8%
$142
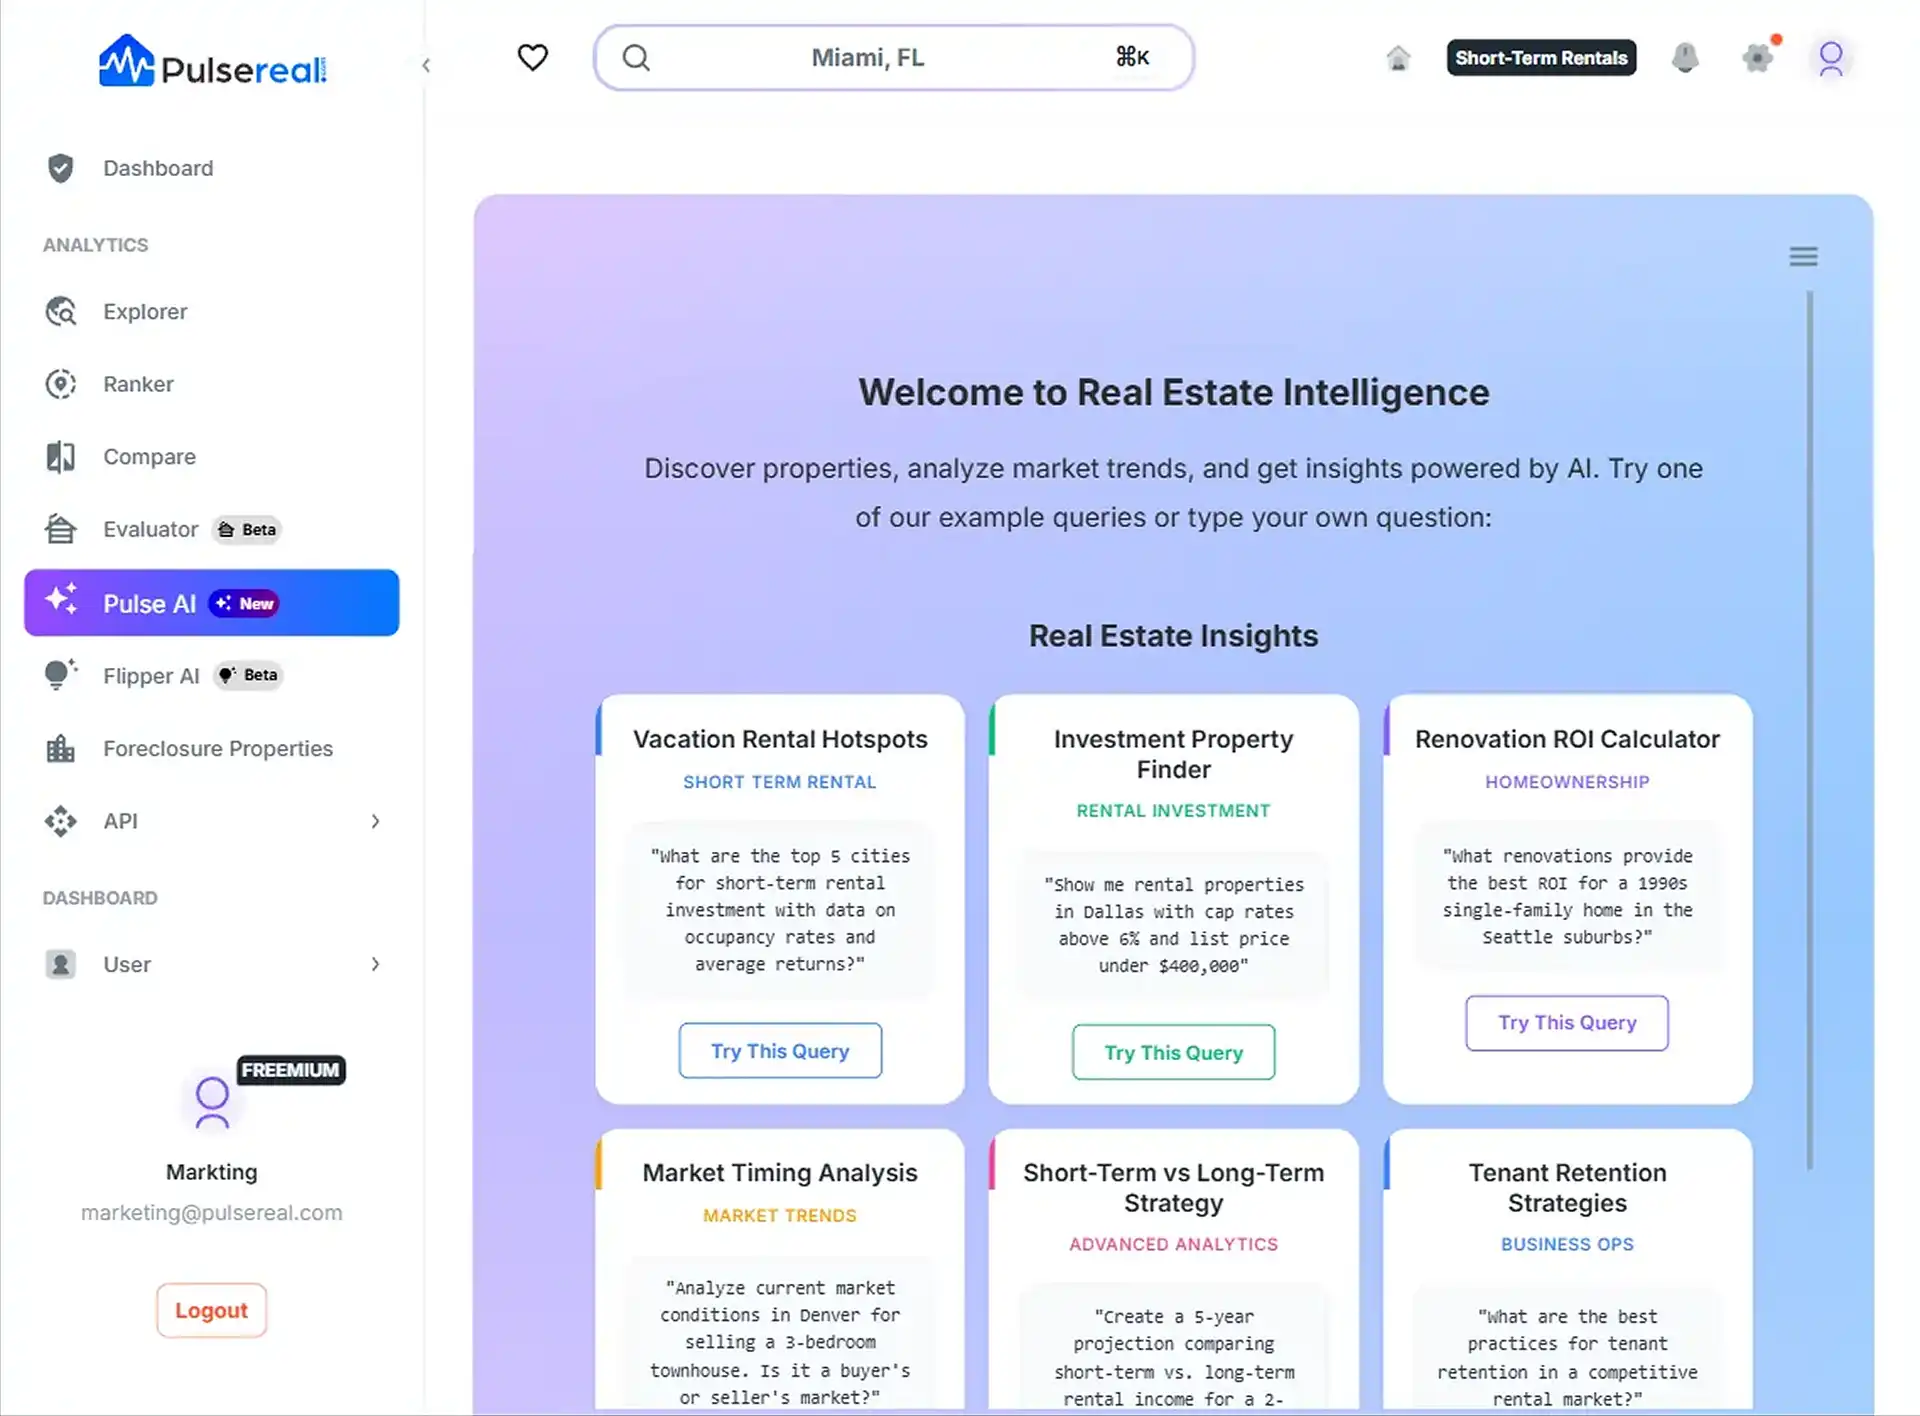
Why PulseReal: Revolutionize Your Property Research with Predictive Analytics
PulseReal is an AI-driven real estate analytics tool that helps investors find top markets, analyze rental trends, track performance, and uncover high-ROI opportunities—making data-backed decisions easier and faster.
From Airbnb investment hotspots to long-term rental markets — make confident moves backed by real-time and historical data.
Predictive analytics for real estate trends
Comparative market analysis software
Historic Market Performance
Short-term and long-term rental income forecasting
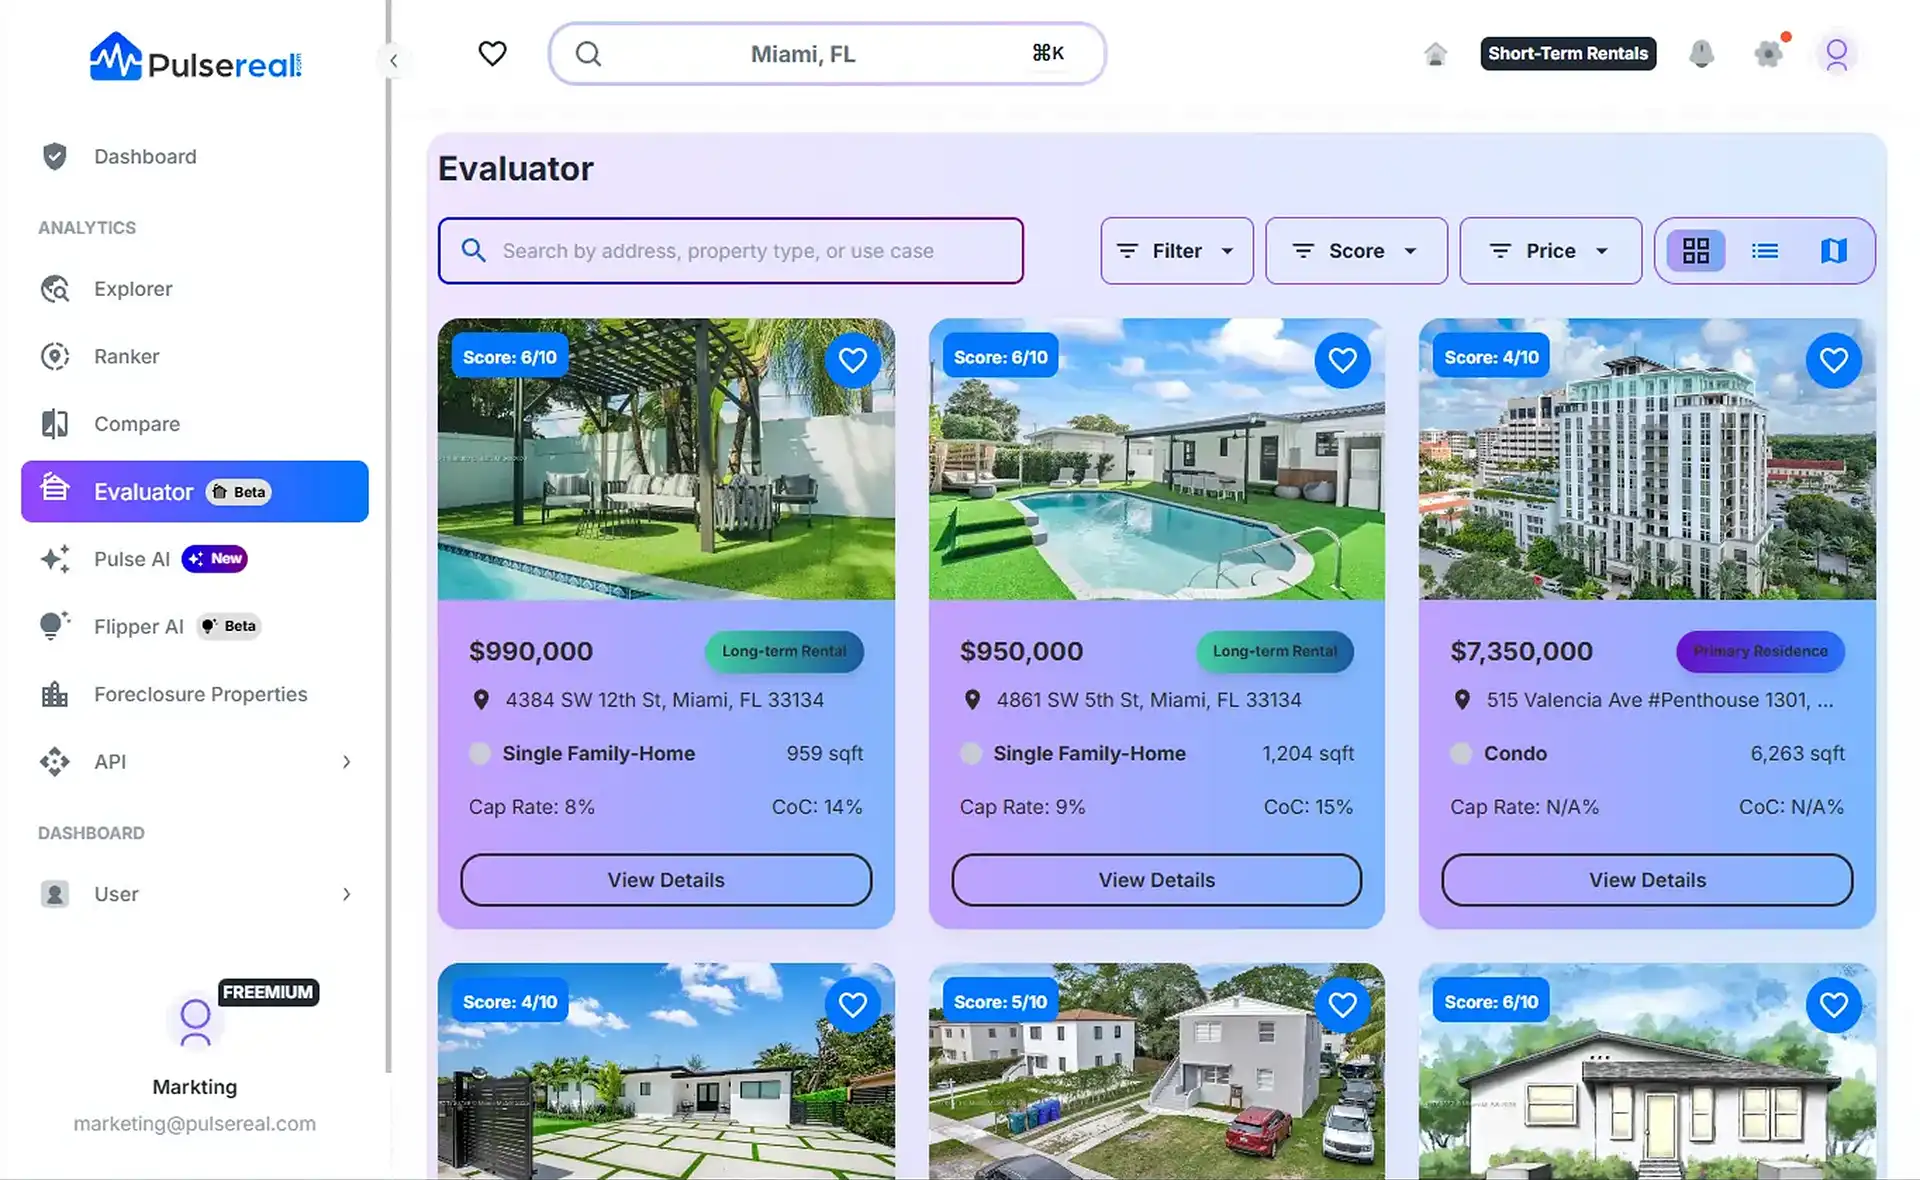
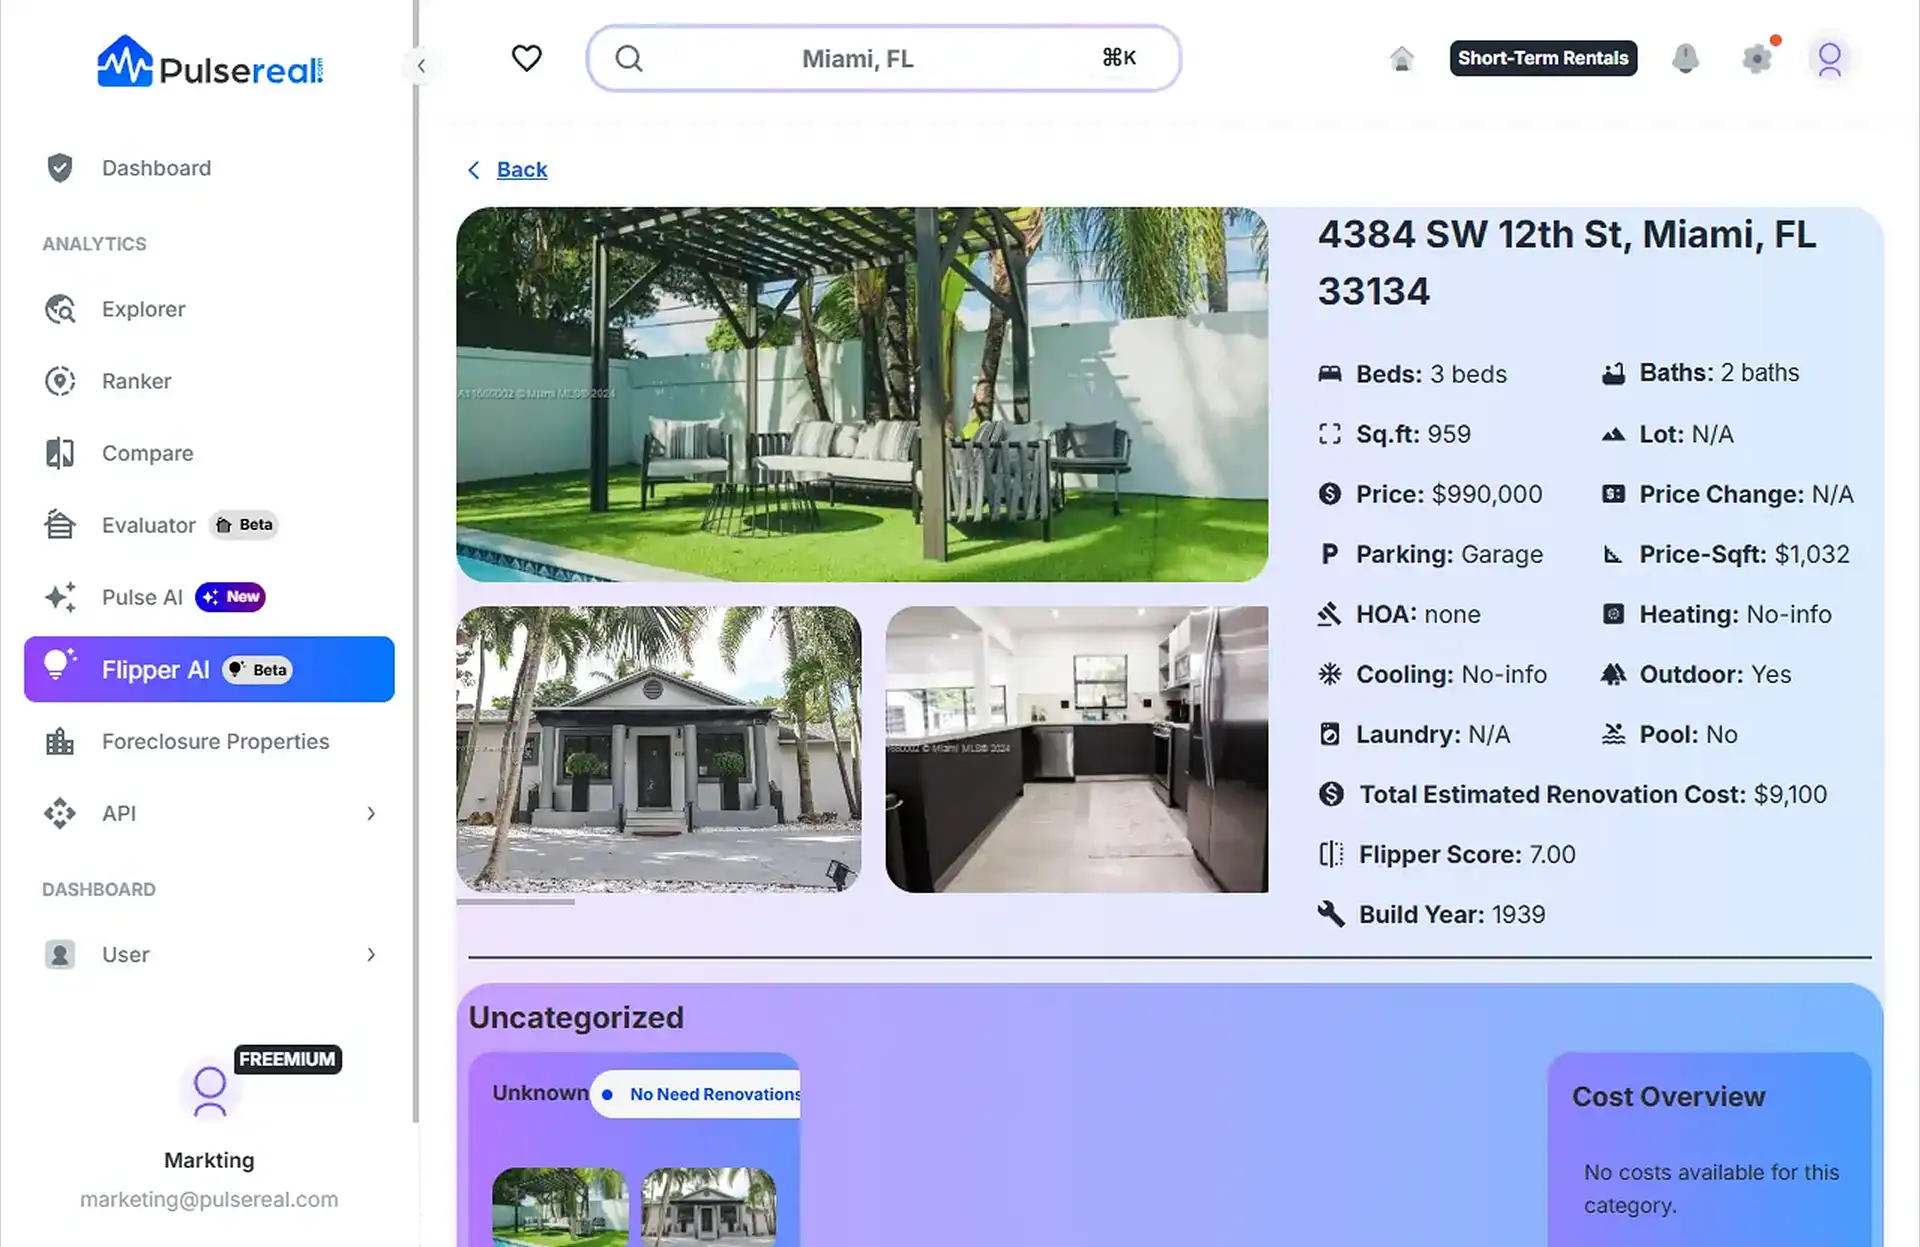
Flipping opportunities and distressed property filters
Explore seasonal patterns and tourism-driven rental opportunities
Analytical Tool
Our proprietary algorithm analyzes hundreds of data points to provide accurate market intelligence
Data Collection
Our system gathers comprehensive data on every location, including:
- Demographics
- Housing Market
- Tourism Metrics
- Rental Rates
- Economic Indicators
- Regulations & Risks
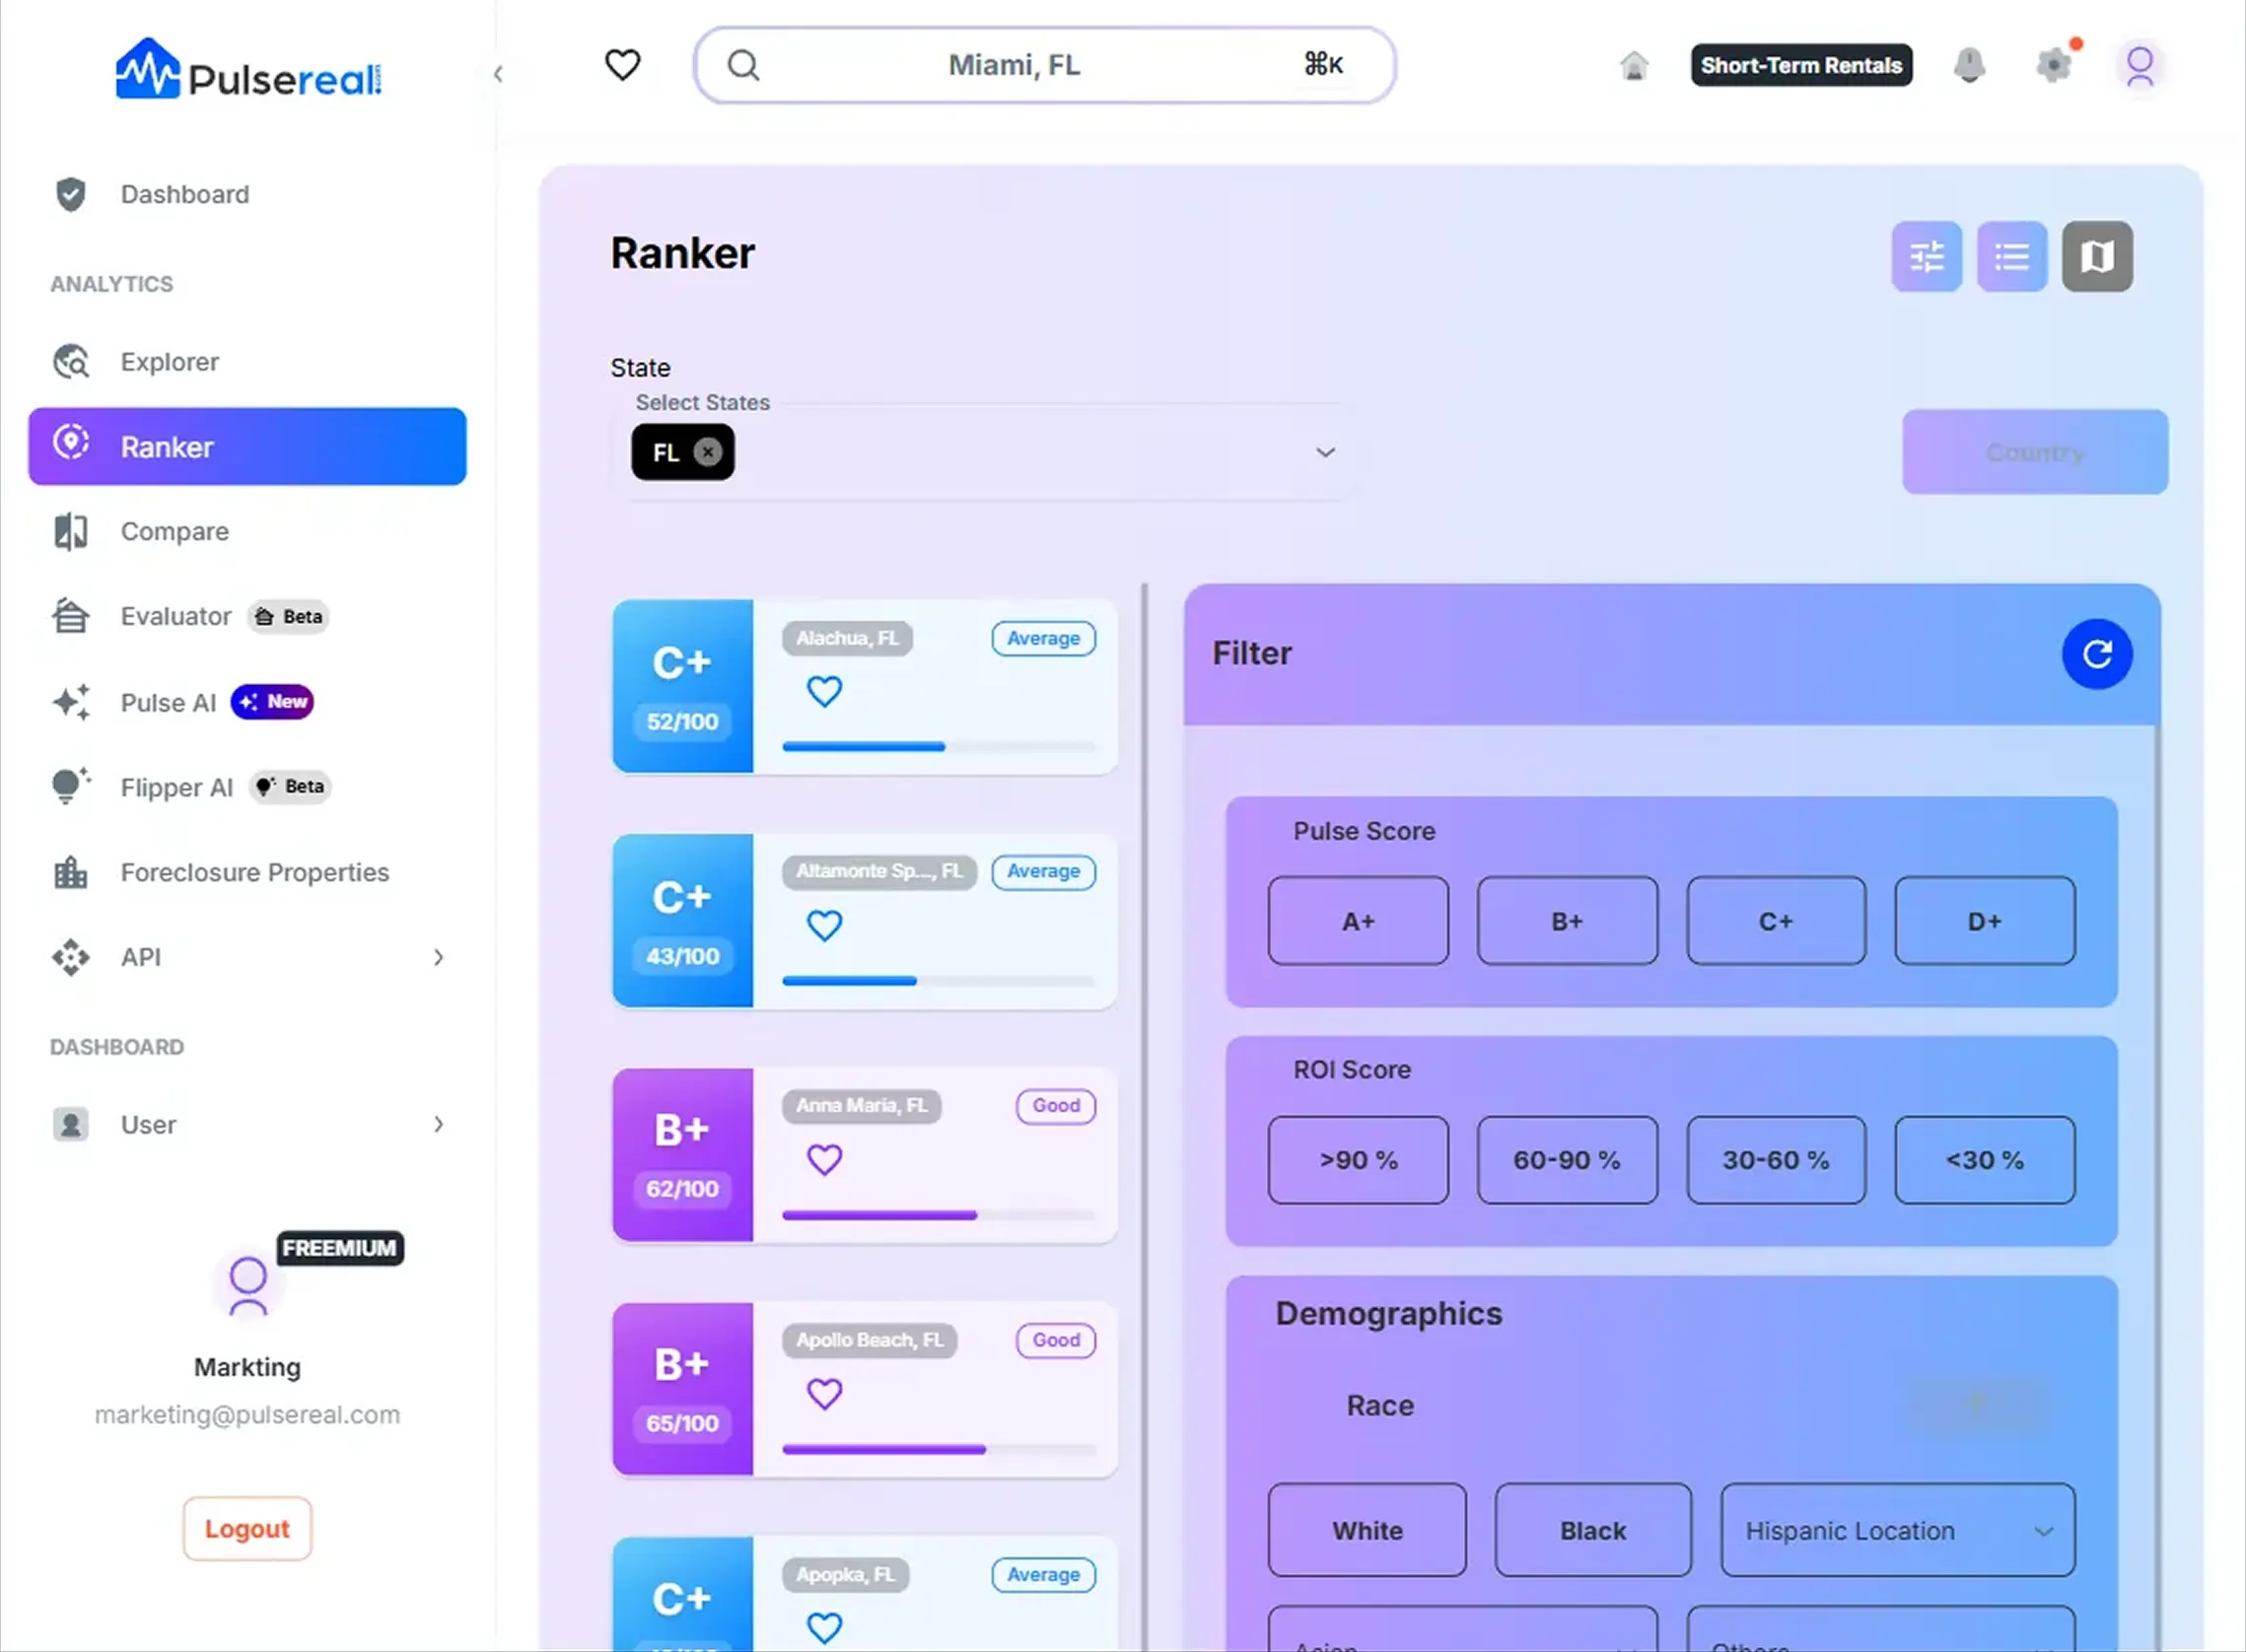
Analysis & Grading
Our AI algorithms evaluate locations based on multiple weighted factors:
Pulse Score
ROI Potential
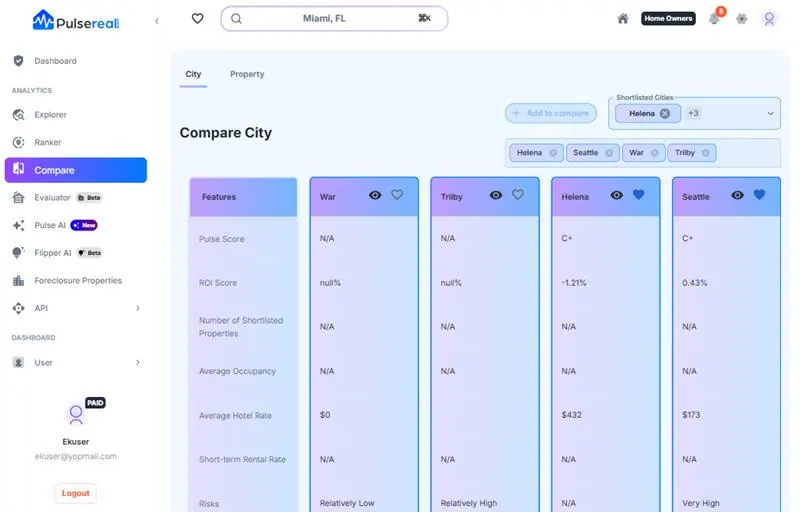
Filtering & Comparison
Apply powerful filters to narrow down locations based on your specific investment criteria:
Everything You Need in One Real Estate Investment Software
Whether you're investing in a vacation rental or evaluating a fix-and-flip, PulseReal equips you with actionable insights.
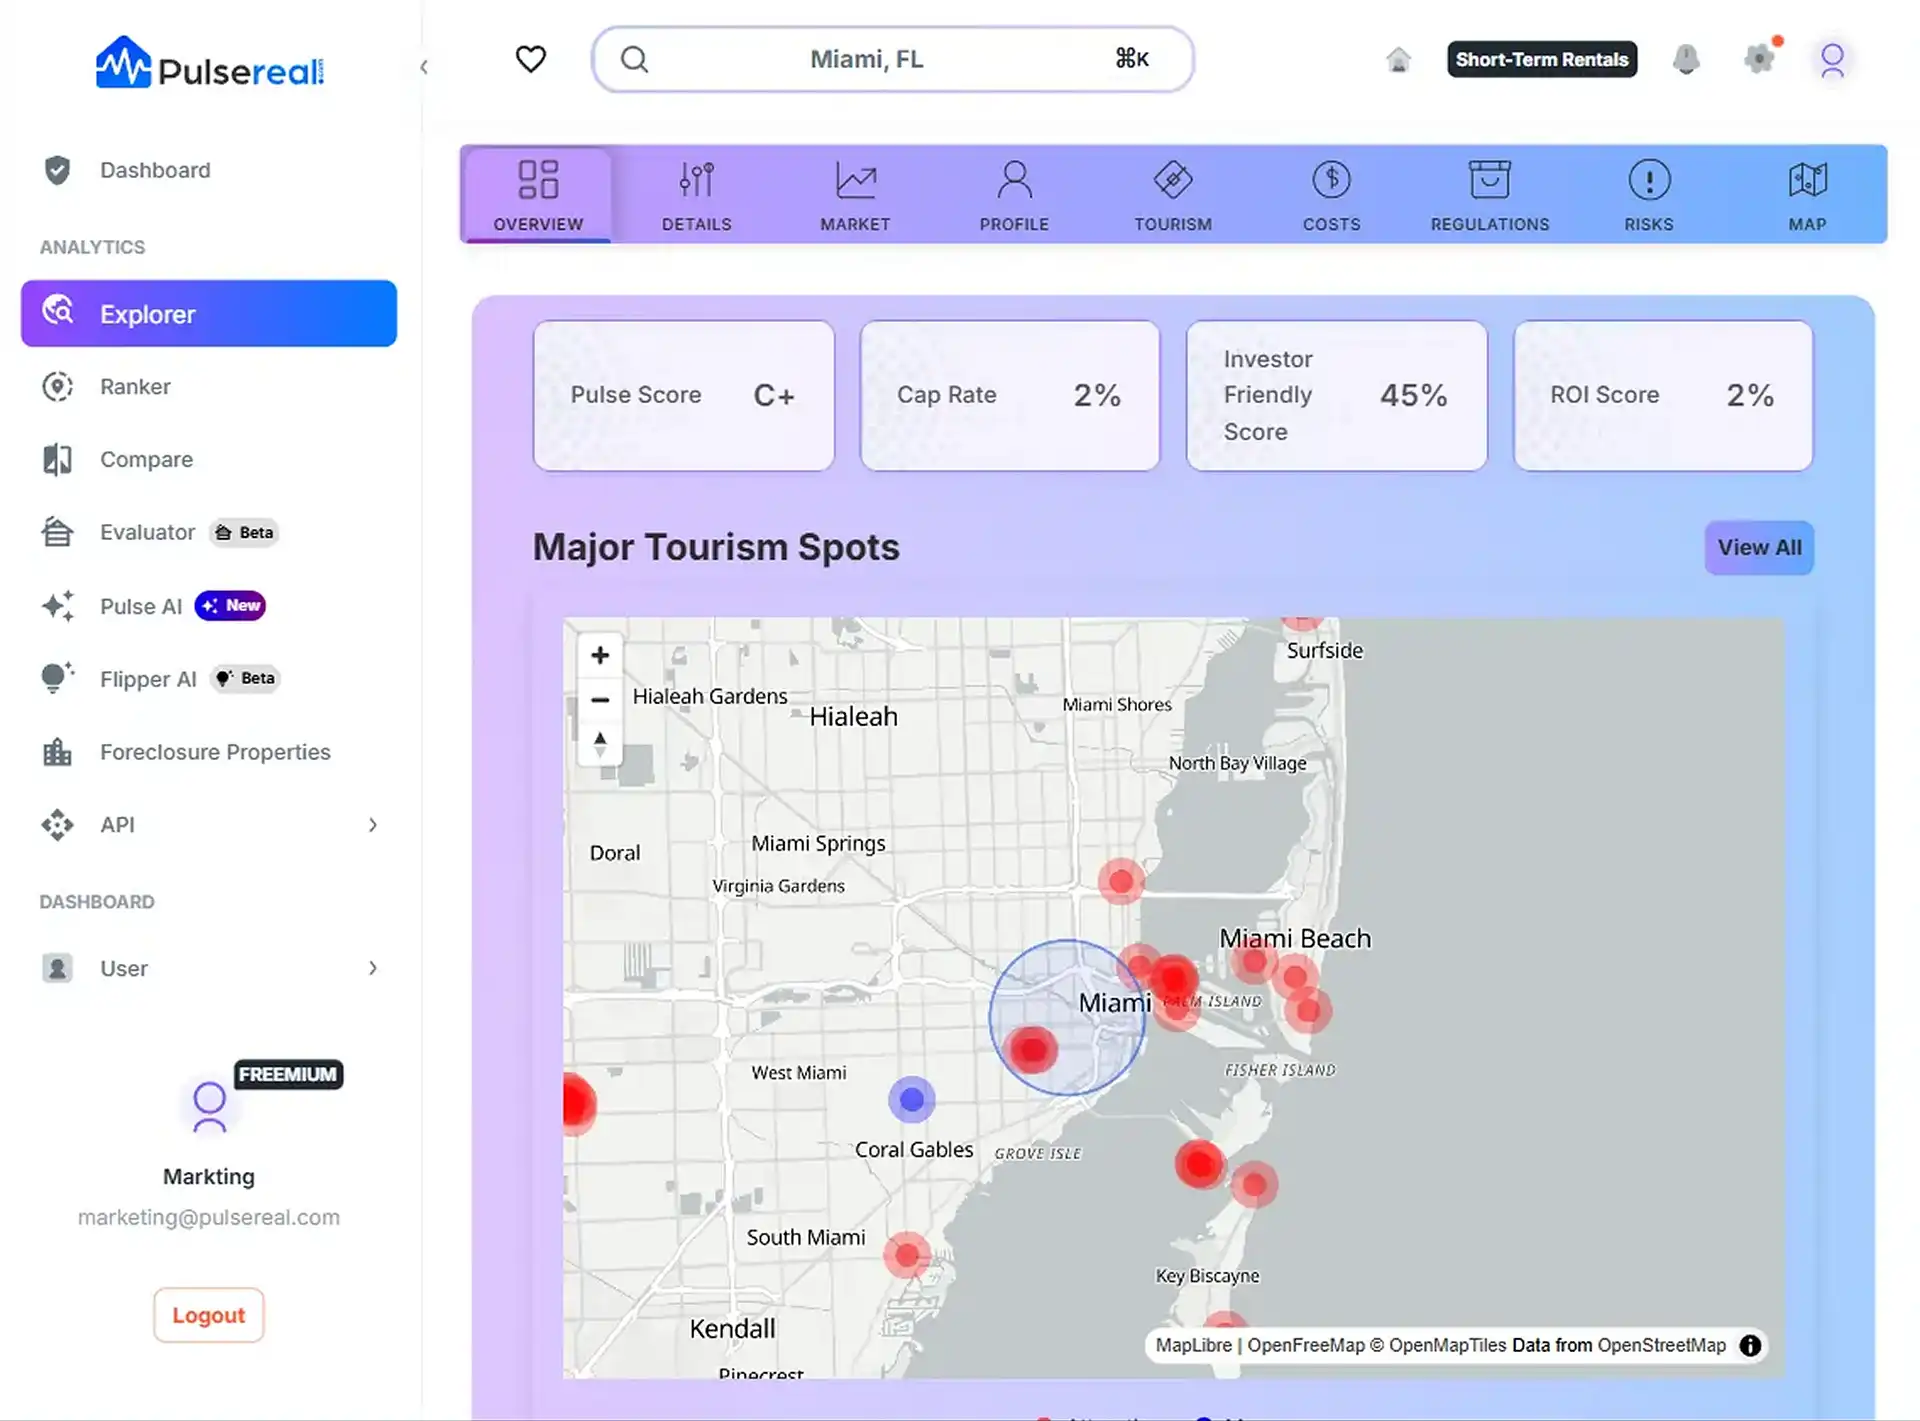
Market Heat Maps
Visual analytics showing the hottest investment opportunities across the U.S. with color-coded ROI potential.
Predictive Analytics Engine
Advanced AI algorithms that forecast market trends, rental demand, and property value appreciation over time.
Rental Income Calculator
Comprehensive tools for calculating short-term and long-term rental income potential with seasonal adjustments.
Tourism Trend Tracker
Monitor local events, seasonal patterns, and tourism spikes to maximize your vacation rental investments.
Property Performance Dashboard
Track your investments with detailed analytics on occupancy rates, revenue trends, and market comparisons.
Comparative Market Analysis
Side-by-side comparison of cities and neighborhoods with key metrics like cap rates, cash flow, and growth potential.
Key Market Indicators
Rental Yield Comparison
Annual rental income as a percentage of property value
AVERAGE YIELD:
66%
Miami
50%
Orlando
30%
Fremont
90%
Atlanta
95%
Price to Rent Ratio
Property value divided by annual rental income
Annual Price Growth (%)
Year-over-year property value appreciation
Miami
42.3%
Orlando
90.7%
Fremont
50.2%
Atlanta
80.5%
Annual Rental Growth (%)
Year-over-year rental income increase
Miami: 8.9%
Orlando: 7.5%
Fremont: 3.1%
Atlanta: 6.3%
What Clients Say About Us
"PulseReal helped me identify an undervalued market in Austin that's now generating 22% ROI on my Airbnb investments. The predictive analytics are incredibly accurate."
Sarah Johnson
Real Estate Investor
Johnson Properties
$2.4M Portfolio
Frequently Asked Questions
Not at all. PulseReal is beginner-friendly and offers a clean interface with visual insights, making it easy to understand market data—even if you're just starting out.
Absolutely. You can compare long-term rental metrics like rent growth, vacancy rates, and market saturation to make informed decisions about buy-and-hold strategies.
Yes, with PulseReal you can compare cities or properties wise side-by-side using key metrics like rental yield, tourism activity, ADR, and growth trends over time.
Yes. Our platform tracks tourism spikes, local events, and seasonal travel patterns so you can align your investments with high-demand windows.
PulseReal updates market data daily for major cities and weekly for smaller locations. Property listings are refreshed every 24 hours, and economic indicators are updated monthly or quarterly depending on the source publication schedule.